graph and chart লেখার কৌশল -একটি Graph And Chart দিয়ে অনেক-Graph and chart লেখার সহজ উপায়
আসছালামু আলাইকুম প্রিয় বন্ধুরা সবাই কেমন আছেন আসা করি সবাই ভালো আছেন আজকে আমরা তোমাদের জন্য Graph And Chart লেখার নিয়ম এবং একটি Graph And Chart দিয়ে অনেক গুলো Graph And Chart লেখার নিয়ম শেয়ার করবো। এখানে আমরা তোমাদের একটি Graph And Chart দিয়ে অনেক গুলো লেখার জন্য ৩ টি নিয়ম বলবো। আসা করি তোমাদের এই ৩ টি Graph And Chat লেখার নিয়ম শিখে গেলে সহজে বুঝতে পারবে এবং Graph And Chat নিয়ে কোন রকম সমস্যা হবে না।একটি Graph And Chart দিয়ে অনেক |Graph and Chart লেখার নিয়ম |Graph লেখার সহজ নিয়ম |Graph and chart লেখার কৌশল
Answer to the Question No-10
প্রিয় শিক্ষার্থী বন্ধুরা তোমাদের সুবিধার জন্য আরো একটি Graph And Chart দিলাম এই একটি graph And Chart দিয়ে অনেক গুলো এবং Graph লেখার সহজ নিয়ম তুলে ধরলাম।
একটি Graph And Chart দিয়ে অনেক |Graph and Chart লেখার নিয়ম |Graph লেখার সহজ নিয়ম
Answer to the Question No-10
Answer to the Question No-10
The graph indicates the rate of internet users in Bangladesh from 2013 to 2017. In the graph we notice that the rate of internet users was 8% in 2013. It is the lowest rate in the graph. But the rate inereased/deereased from 8% to 15% within I year. Then, we see a fall/rise in the rate of internet users in 2015. In that time the rate of internet users was 20%. Again, we find a drop/fall/rise in the rate of internet users in 2016. In that time the rate was 28%. At last we see that the rate of internet users increased/decreased from 28% to 40% by 2017. It is the highest rate in the graph/chart. After analysing the graph we can come to a conclusion that the rate of internet users is increasing/decreasing day by day which is a positive/negative sign for our country.
Graph and Chart লেখার নিয়ম | একটি Graph And Chart দিয়ে অনেক | Graph and chart লেখার সহজ উপায় | Graph লেখার সহজ নিয়ম
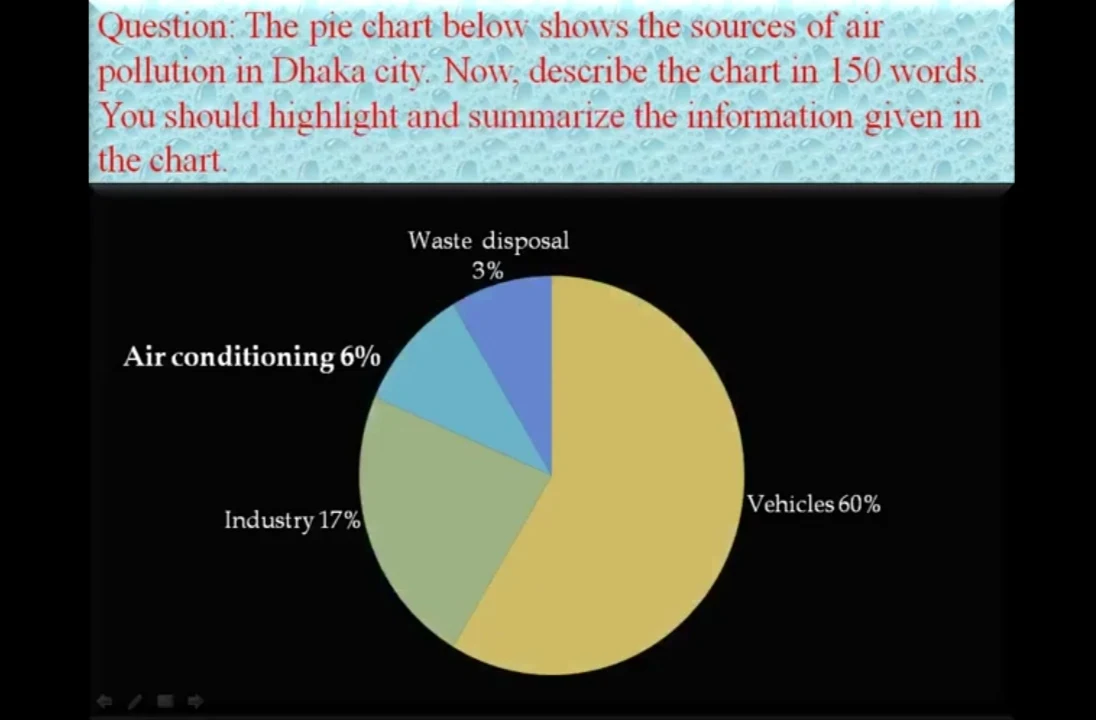
★The pie chart indicates the sources of air pollution in Dhaka city. In the chart we notice that 60% of air is polluted by vehicles. It is the highest rate in the chart. On the other hand, only 3% of air is polluted by the disposal of waste materials. It is the lowest rate in the chart. Then, we see that industries pollute 17% of air. So it is clear that the second rate of pollution comes from industries. At last, we see that 6% of air is polluted by the use of air-conditioners. After analysing the chart we can come to a conclusion that we should improve the condition of our vehicles and industrial atmosphere to reduce air pollution.
Tag:Graph and Chart লেখার নিয়ম,একটি Graph And Chart দিয়ে অনেক,Graph and chart লেখার সহজ উপায়,Graph লেখার সহজ নিয়ম,Chart লেখার নিয়ম,সহজে Graph And Chart লিখুন,Graph And Chart লেখার সহজ পদ্ধতি

Any business enquiry contact us
Email:-Educationblog24.com@gmail.com
(সবচেয়ে আগে সকল তথ্য,গুরুত্বপূর্ণ সকল পিডিএফ, প্রতি মুহূর্তে। ফলো করুন আমাদেরGoogle News,FacebookএবংTelegram পেজ)


